Strategic Report
02


2.1
Market analysis
Railway container transportation market
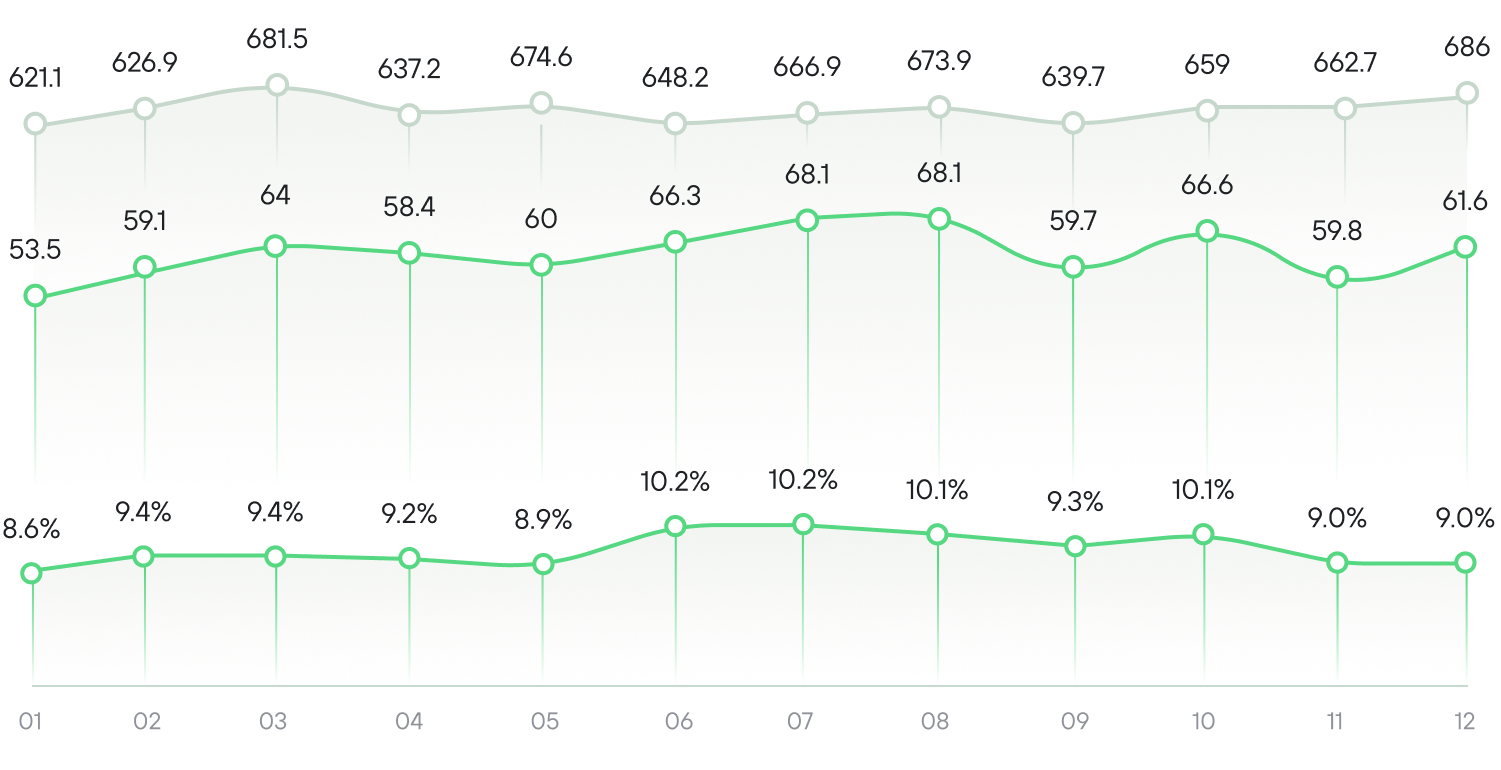
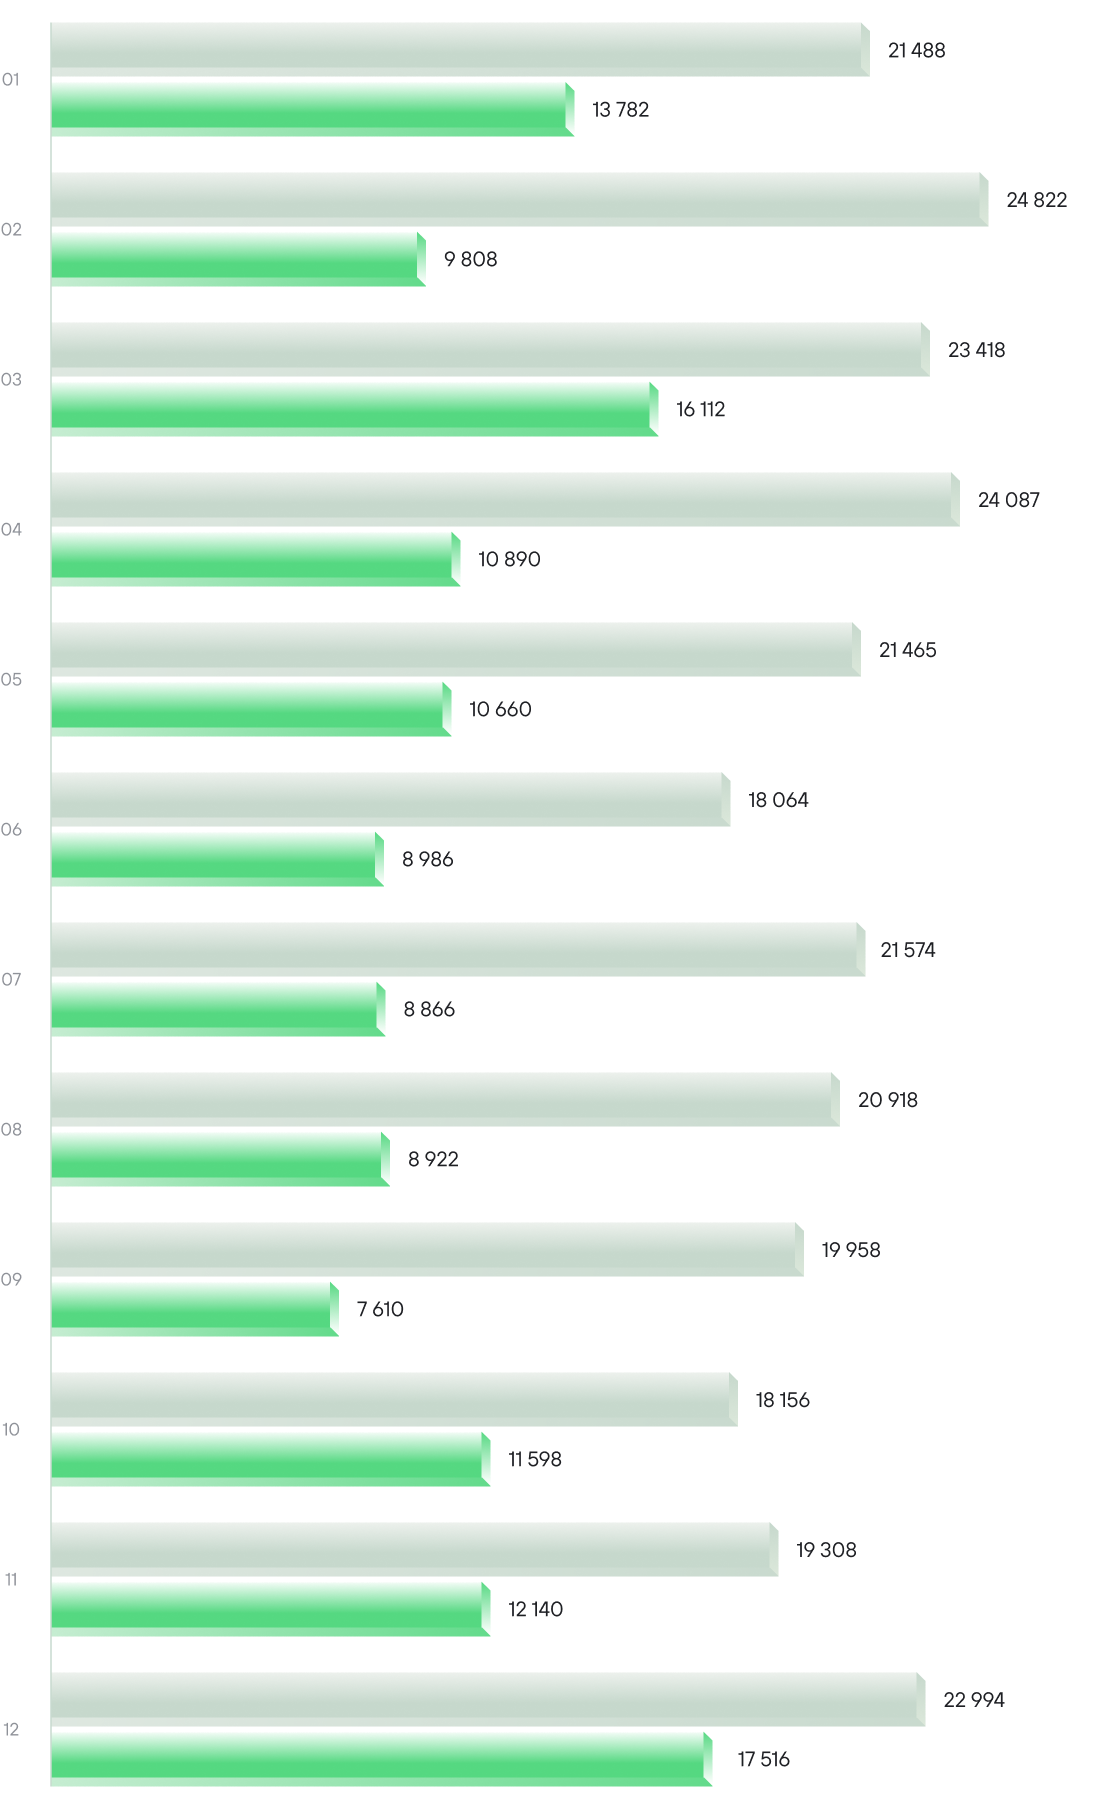
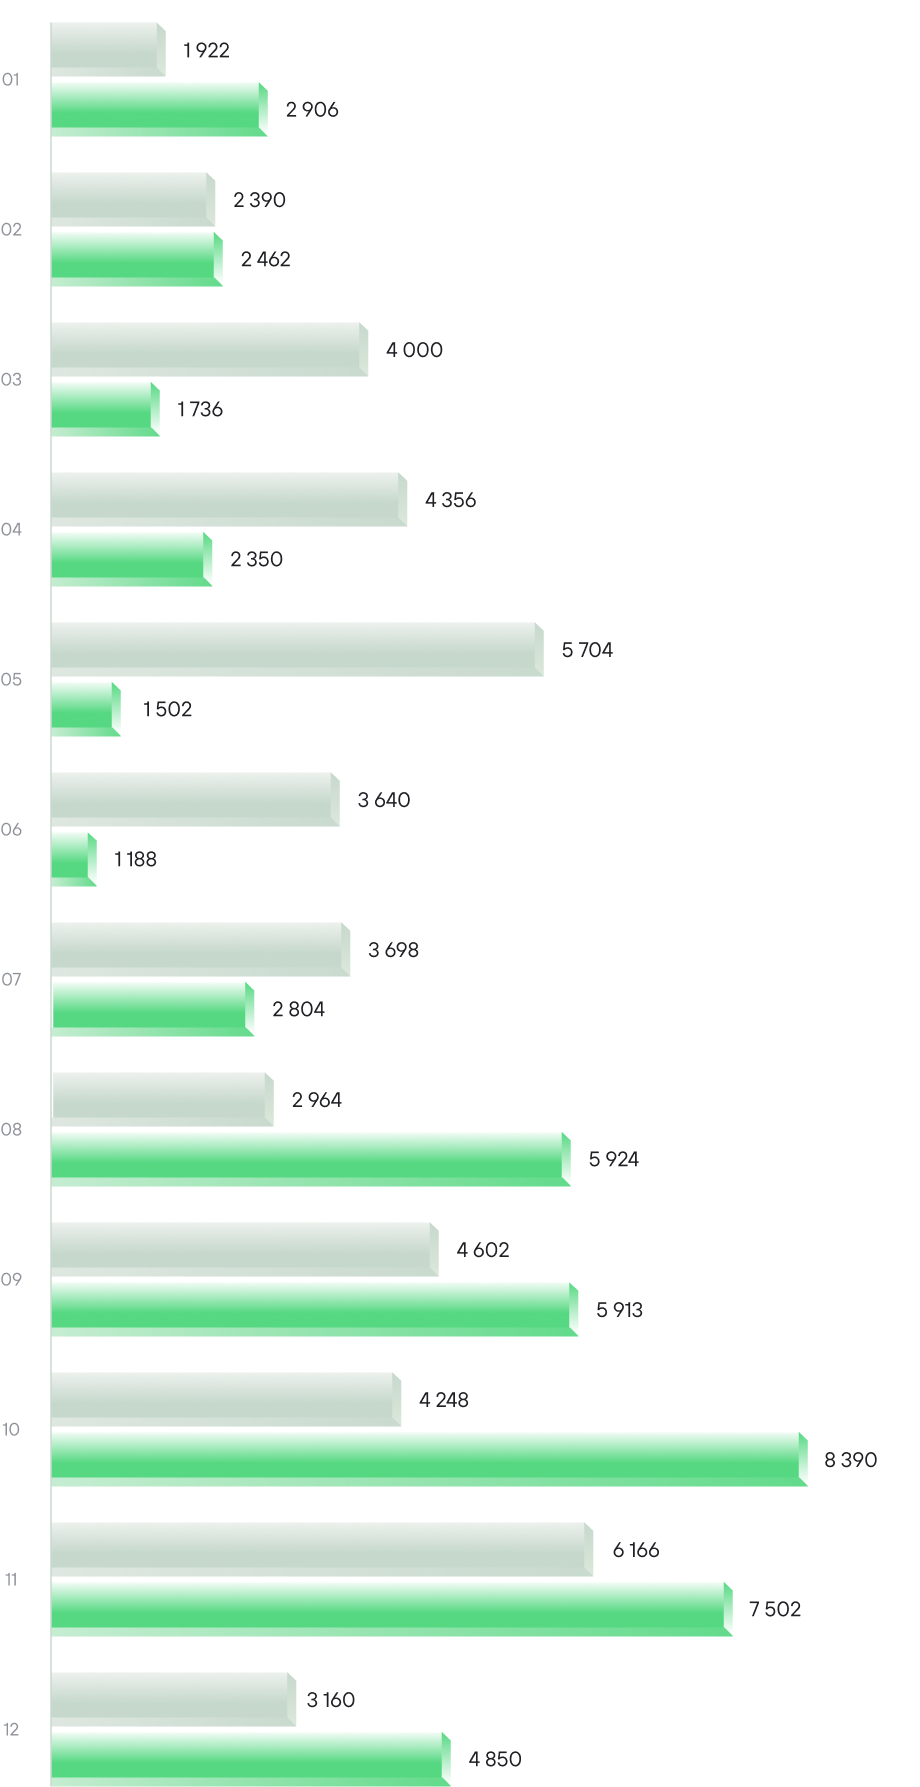
Based on the results of 2024, Russian Railways handled 7.9 million TEU in container traffic. UTLC ERA, in turn, held a 9.5% share of this volume, reaching 745.9 thousand TEU. The volume of shipments surpassed the Company’s 2023 result by 10.7%.
In 2024, the primary trend for UTLC ERA was the recovery of transit volumes between China and Europe during the first half of the year. At the end of 2023, UTLC ERA’s main service declined to below 15 thousand TEU per month. However, from January 2024, transit volumes grew month by month, peaking at 39.8 thousand TEU in July. In the third quarter of 2024, China–Europe ocean freight rates began to plunge, following a long period of growth triggered by the Red Sea crisis. Key factors included excess capacity from carriers, weaker demand amid rising tensions between trading partners, and improved container equipment availability. By the end of the year, China–Europe ocean freight rates had dropped by 50% from their July–August highs.
Normalized ocean freight rates and improved availability have had a major effect on rail container transit volumes. Export on dual-use goods are also an important factor to mention. Nonetheless, volumes continued to outpace those of the previous year.
In 2024, UTLC ERA’s container traffic and market share on the JSCo "RZD" network
thousand TEU and %
Source: company.rzd.ru
Total container traffic (loaded and empty) via the JSCo "RZD" network
UTLC ERA
It is also important to highlight that the company’s import services have depended on transit trends during the year. Following the decline in transit at the end of the year, imports to Russia and Belarus were ramped up.
Shares of transportation directions in UTLC ERA’s services in 2023,
%
Shares of transportation directions in UTLC ERA’s services in 2024,
%
key categories by value include
19.7%
electrical and communication equipment
18.5%
mechanical equipment and computers
14.6%
automotive products
5.3%
optical and medical devices
4.7%
sewn clothing
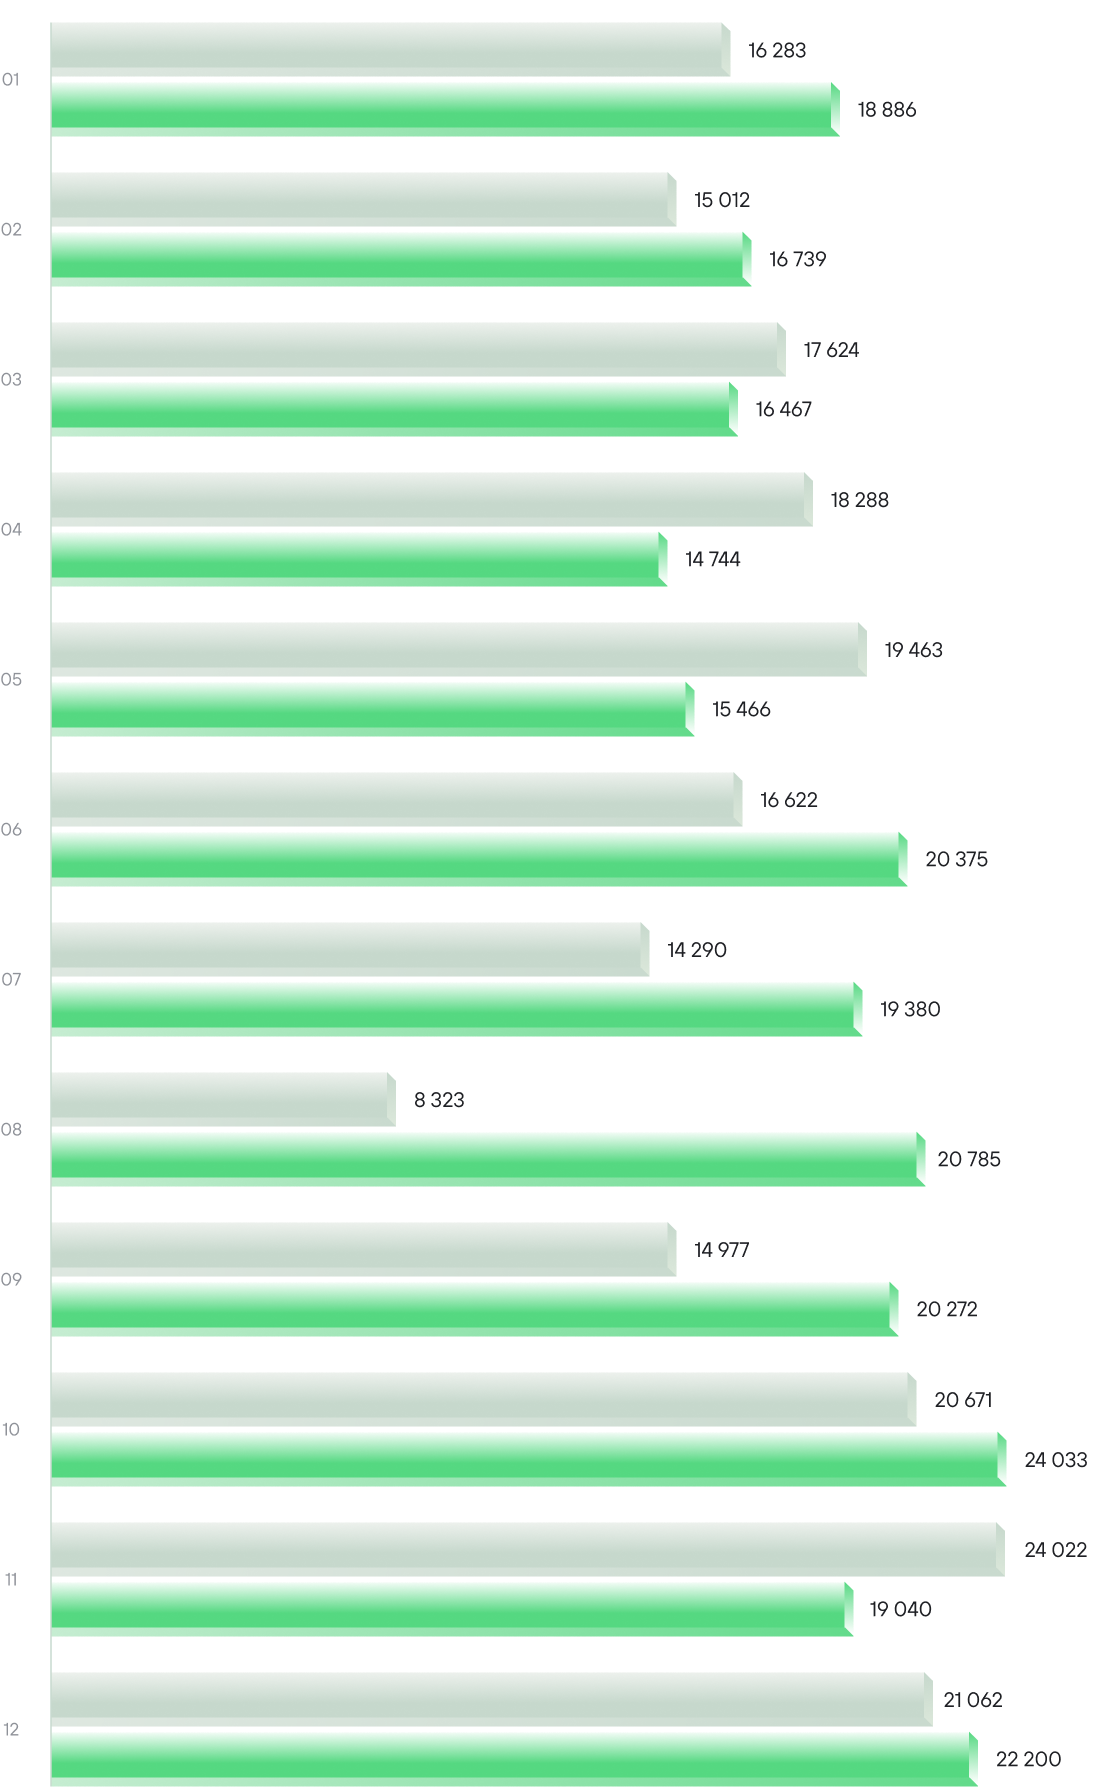
Transit transportation
China–Europe–China
China‑Europe‑China transit transportation
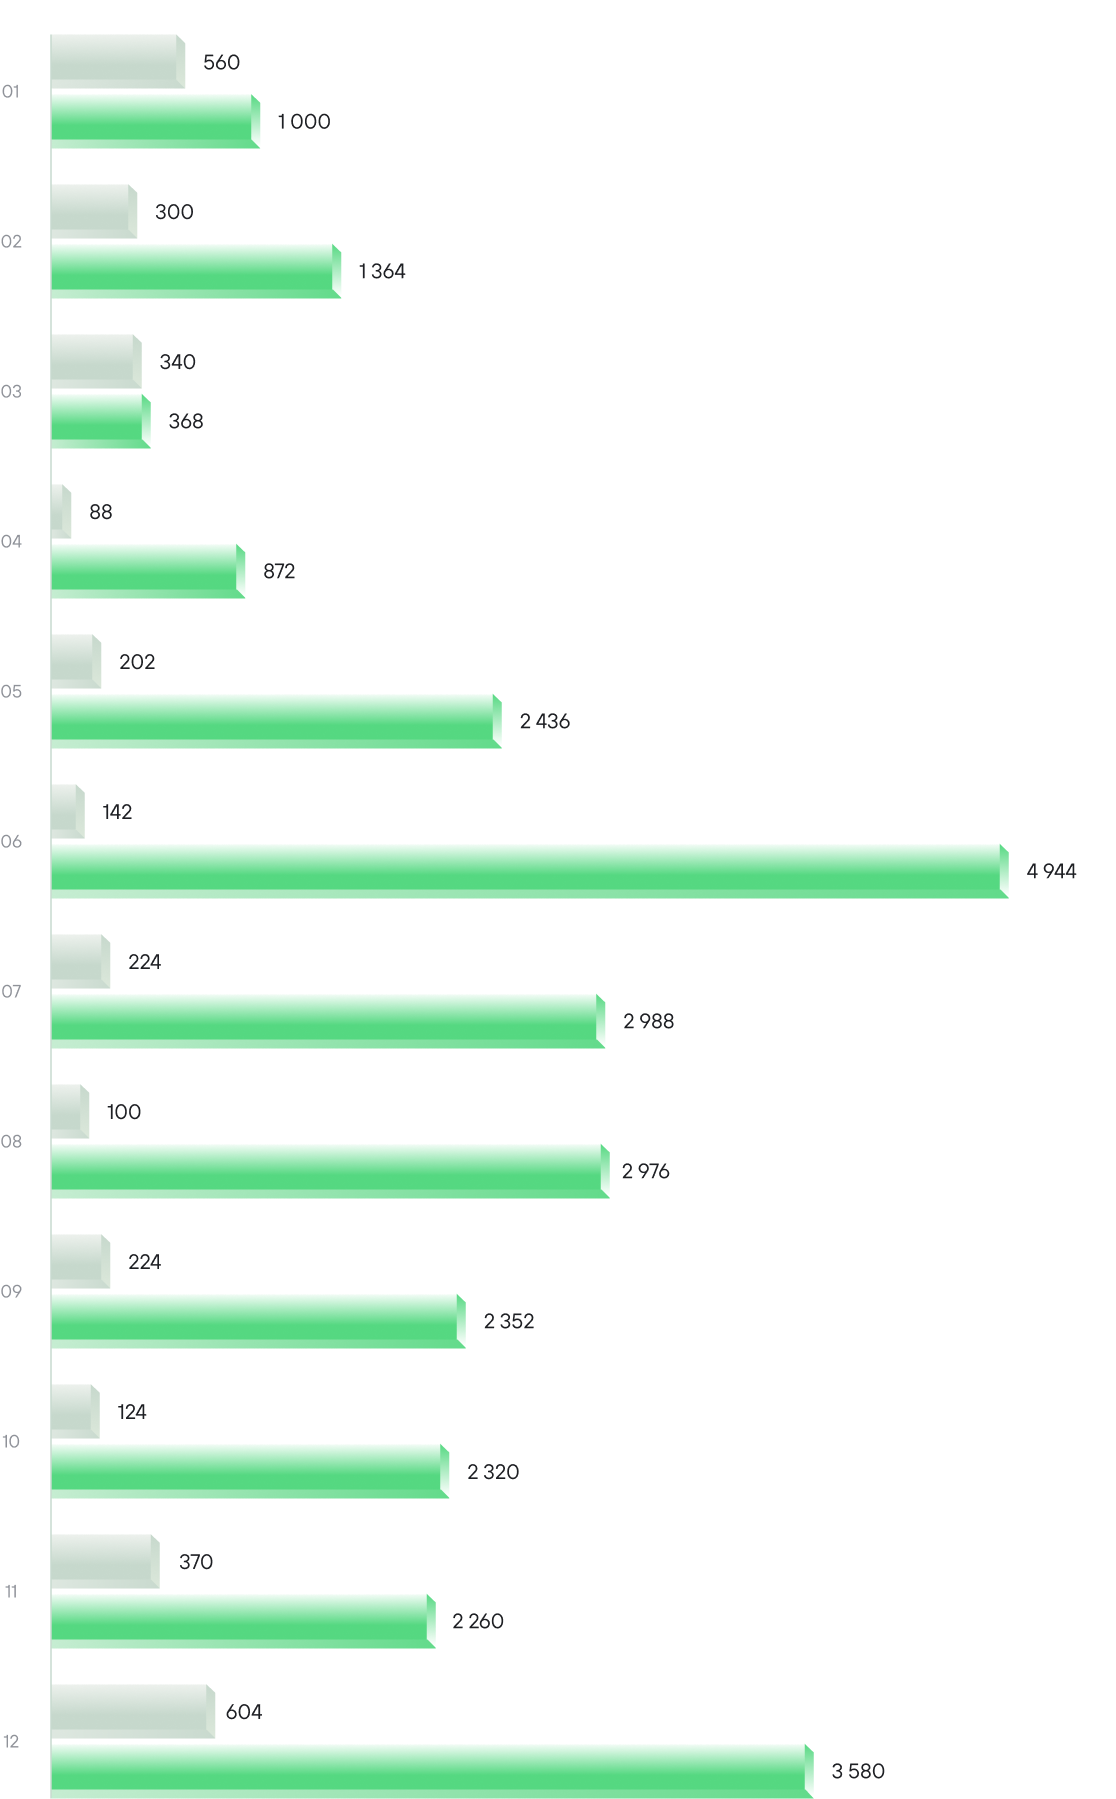
Transit volumes showed positive trends during 2024. Total transit volume via all corridors—including the Trans‑Caspian International Transport Route (TITR) reached 429,465 TEU in both directions, up 94.9%
429,465
TEU
total transit volume via all corridors
Volumes of rail transit container transportation in total and by direction; shares of major corridors in transportation in 2024,
% and TEU
China - Europe - China
China - Europe
Europe - China
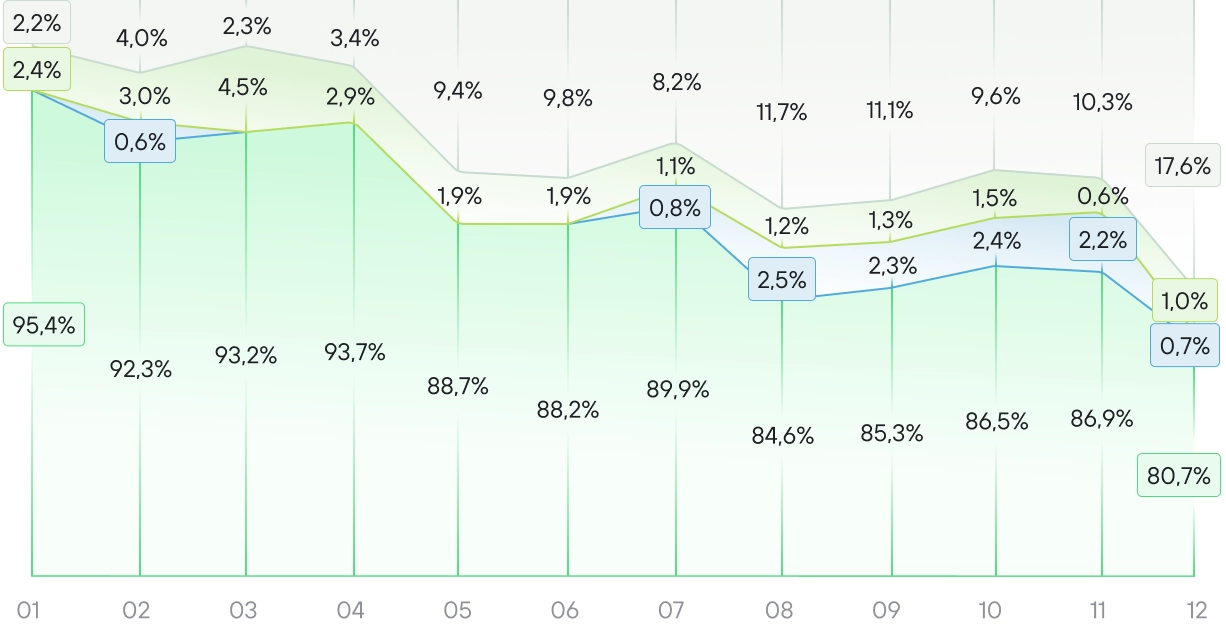
Share trends of border crossings on the China‑Europe‑China route in 2024, %
Source: UTLC ERA
TITR
Zabaykalsk
Naushki
UTLC ERA
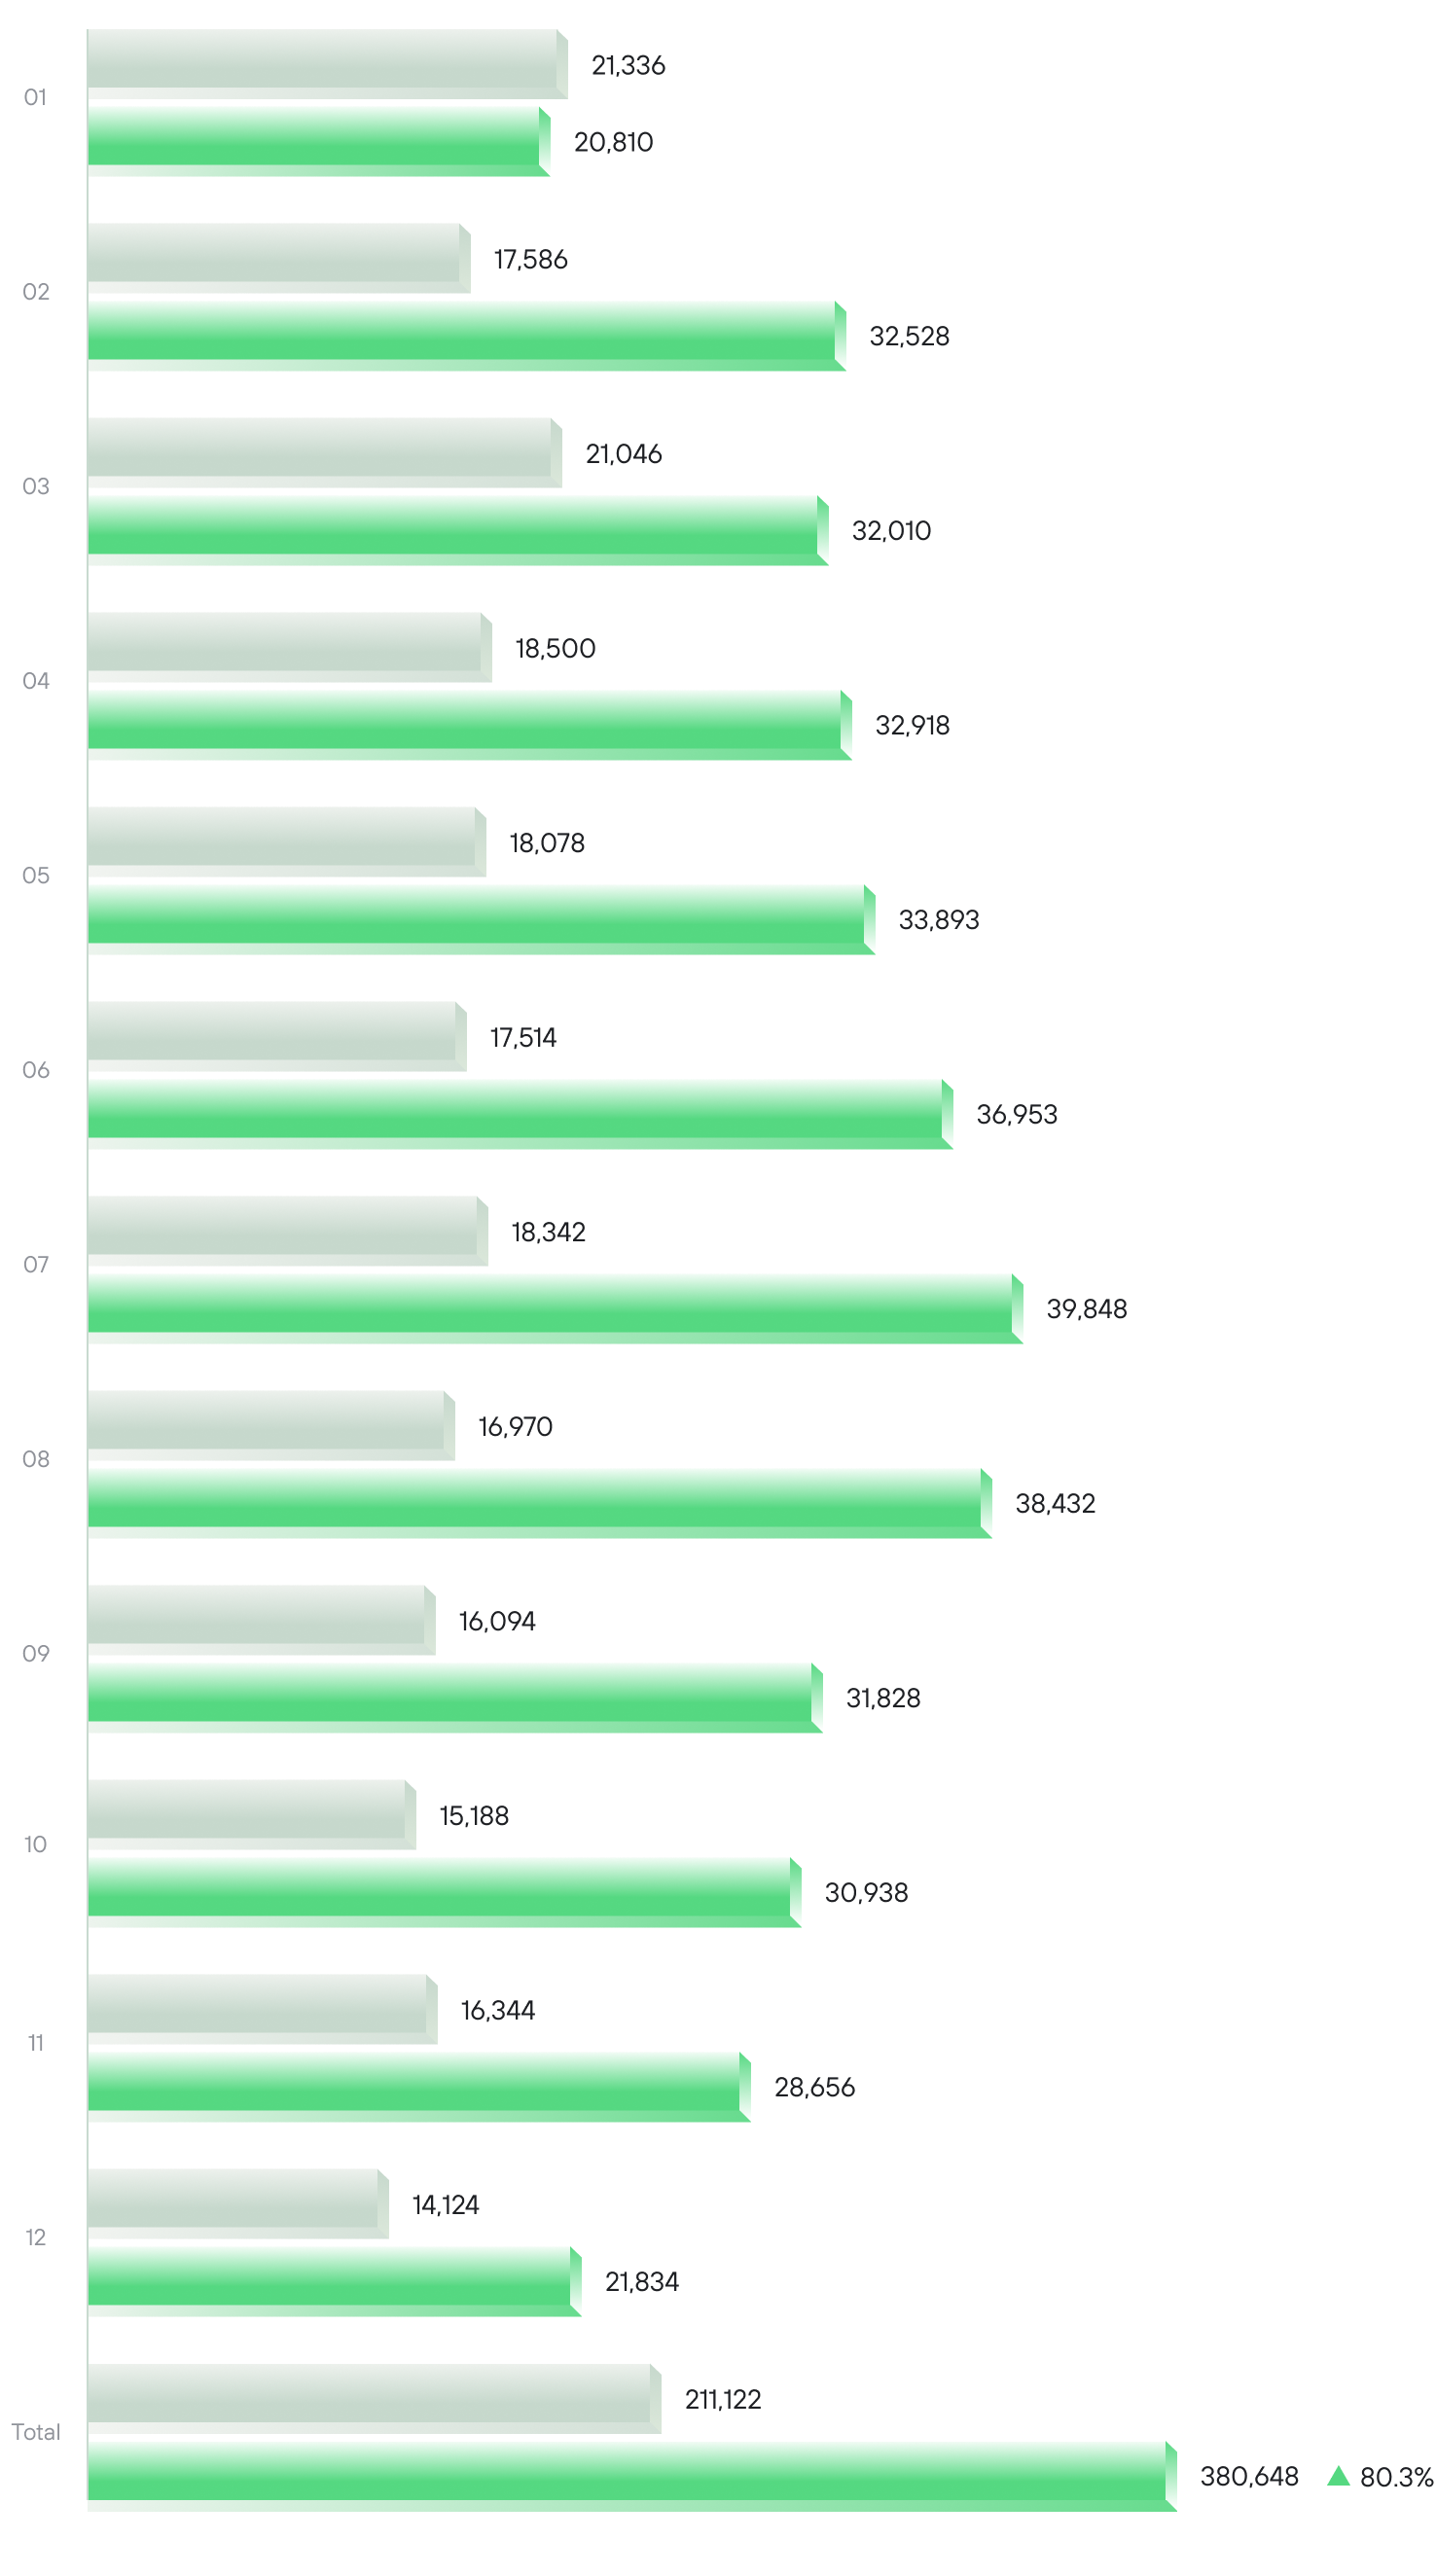
UTLC ERA’s shipments on the China‑Europe‑China corridor totaled 380,648 TEU in 2024 (a year-on-year rise of 80.3%). The Company’s share of total corridor shipments was 88.6%. U‑WEST route volumes totaled 330,896 TEU for the year, a 130.9% increase over last year. U‑EAST route volumes dropped 26.7% to 49,752 TEU.
380,648
TEU
The volume of transportation of UTLC ERA on the China‑Europe‑China route.


By year-end, transit shipments via the Zabaikalsk corridor rose 66.6%
year-over-year to 8,212 TEU, with most growth coming from eastbound flows while China‑Europe shipments also showed positive momentum. In 2024, the total volume transported via the Naushki corridor reached 4,358 TEU (+186.1% versus 2023). Transit container shipments between China and Europe have not been routed through Far Eastern ports and stations since January 2023. 2024 saw a dramatic rise in westbound shipments via the TITR corridor, with volumes surging over 13 times year-on-year to 36,247 TEU1. The main increase in cargo flows started in April 2024, with the corridor’s share of China‑Europe‑China shipments holding steady at 10% monthly and reaching 17.6% in December.
1 Data provided by JSC "NC "KTZ"
8,212
TEU
transit shipments via the Zabaikalsk corridor
4,358
TEU
the total volume transported via the Naushki
Factors driving the growth of transit freight volumes
-
Rising sea freight rates during the first half of 2024 encouraged shippers to seek alternative transport options.
-
Rebounding demand from European retailers for imported goods, prompted by worries over supply chain instability and increasing trade tensions with China.
Nonetheless, in Q3, the ocean freight market adapted to these challenges and rates dropped sharply, potentially impacting rail transport volumes.
By year-end, ocean carriers were able to stop the downward trend and maintain rates higher than originally expected.
As of December 2024, the ERAI composite index recorded the cost of transit container shipments
in the Eurasian rail corridor (EAEU, China—Europe—China) at $3,215 per TEU. By late December, the WCI (maritime shipping) index for Shanghai to Rotterdam reached $4,811.
$ 3,215
the cost of transit container shipments in the Eurasian rail corridor (EAEU, China — Europe — China)
$ 4,811
the WCI (maritime shipping) index for Shanghai to Rotterdam
$ 3,215
cost of transit container transportation in the Eurasian railway corridor of the East-West Mainline (EAEU, China - Europe - China)
$ 4,811
WCI shipping index for the Shanghai–Rotterdam route
Volume of transit container transportation China - Europe - China in the services of UTLC ERA in 2023-2024, TEU
Source: UTLC ERA
2023
2024
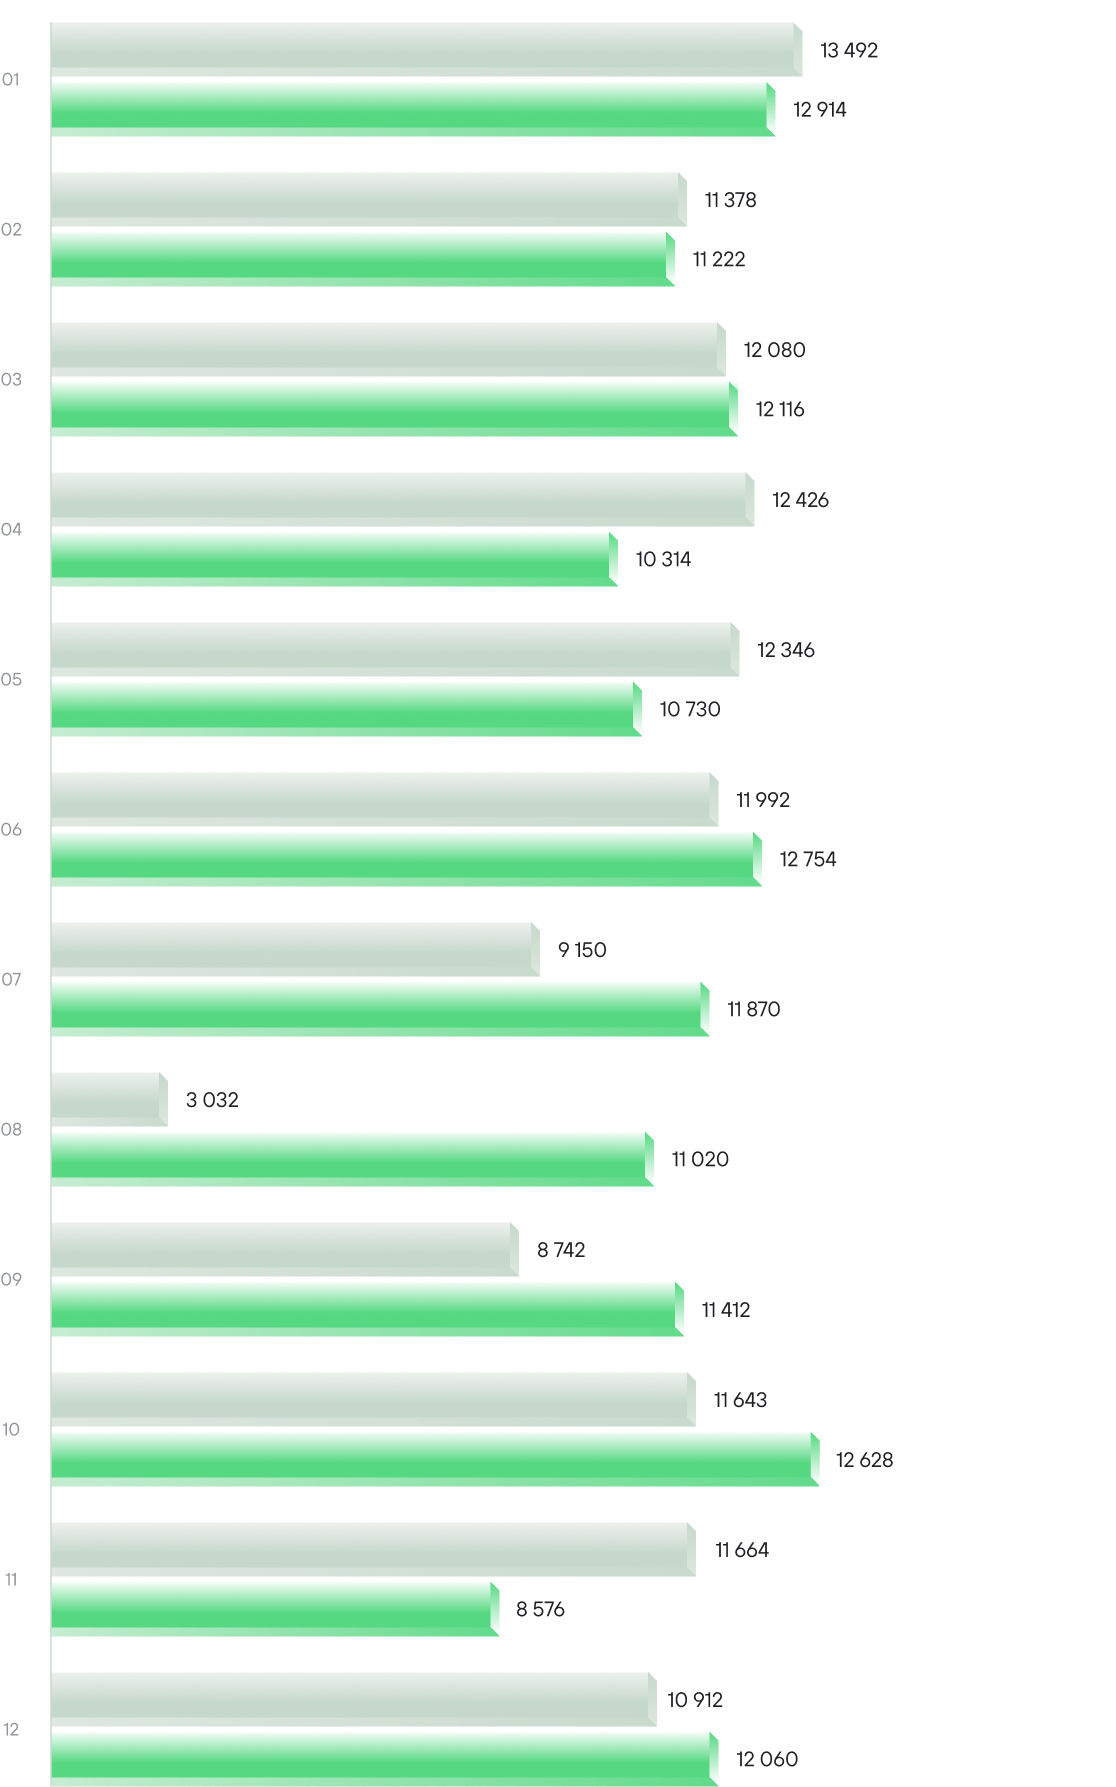
Import rail transportation China - Russia/Belarus
In 2024, import shipments made up 18% of UTLC ERA’s total transport volume. Accordingly, total import volumes handled by the Company reached 136,774 TEU, representing a 46.6% decrease year-on-year.
136,774
TEU
volume in import services of UTLC ERA
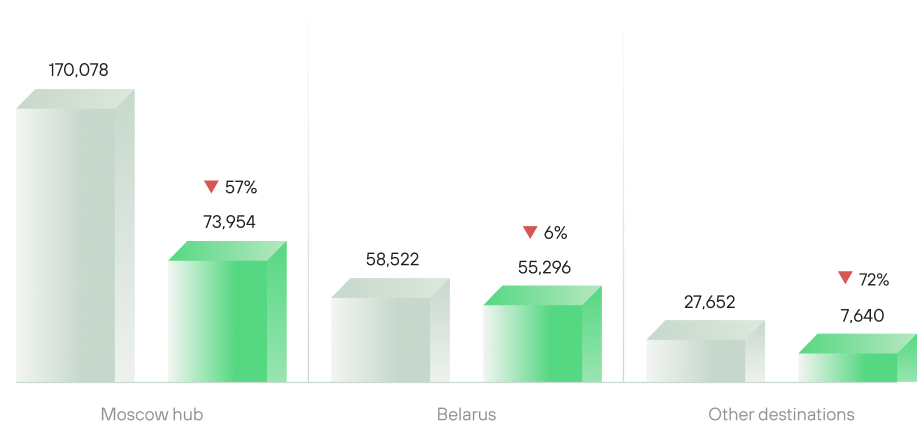
As part of import, 78,470 TEU were transported between China and Russia. Consequently, this segment saw a 68.8% drop year‑on‑year compared to the same period in 2023. Of these, 73,954 TEU went to the Moscow railway hub, with the rest distributed among St. Petersburg, the Urals, and Tatarstan. Another import segment for UTLC ERA, the China‑Belarus route, saw volumes reach 55,296 TEU, a slight decrease from the previous year (down 5.5%).
Special mention should be made of import shipments of household appliances to stations of the Moscow rail hub in the eastbound flow. Transport operations from Budapest commenced in April 2024, with 3,008 TEU shipped under the project by year’s end.
Volume of import container transportation in UTLC ERA services by directions in 2023‑2024, TEU
Source: UTLC ERA
2023
2024
Volume of import container transportation China — Russia/Belarus in UTLC ERA services in 2023-2024,
TEU
Source: UTLC ERA
2023
2024
Regarding import transport, a major trend in the eastern corridors is worth noting. With the reorientation of cargo flows towards the east, Russian imports have shown steady growth. However, in 2024, the Far East faced a persistent crisis of container terminal overcrowding, as imports arriving at regional ports occupied almost all container storage capacity at seaport and hinterland terminals in Primorye. A key challenge is the acute lack of available railcars. In the fourth quarter, Russian Railways (RZD) partially mitigated congestion at transshipment nodes by enforcing strict controls, yet the problem endures and is expected to further constrain import traffic.
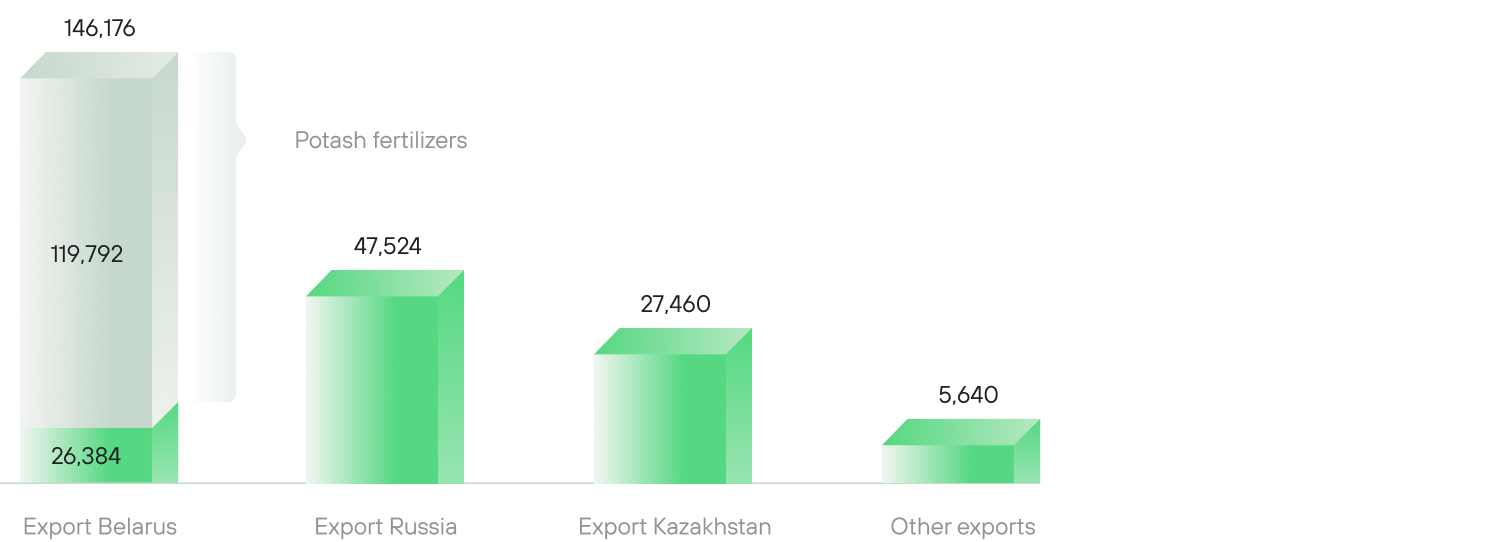
Russia/Belarus – China/Central Asia export rail transportation
The share of export and other shipments in UTLC ERA services showed the least change versus 2023, remaining at 30%. In total, 226,800 TEU were shipped from Kazakhstan, Russia, and Belarus to China via export services, marking a 9% year-on-year increase.
226,800
TEU
UTLC ERA export container volumes
Fertilizer exports from Belarus to China represented a substantial share — 52.8% of shipments, with a total of 119,792 TEU transported. UTLC ERA shipments accounted for ~15.4% of Belarus’s total potash exports in 2024. Other export shipments from Belarus also increased, reaching 26,384 TEU (compared to 24,300 TEU in 2023).
UTLC ERA export container volumes in 2023 and 2024, TEU
Source: UTLC ERA
2023
2024
UTLC ERA export container volumes in 2023 and 2024, TEU
Source: UTLC ERA
2023
2024
Export containervolumes from Belarus in UTLC ERA services in 2023–2024, TEU
Source: UTLC ERA
2023
2024
from Russia to China
Export shipments from Russia to China totaled 47,527 TEU, down 3% from the same period in 2023.
This decline was mainly driven by shifts in the cargo structure. Specifically, lumber exporters have transitioned almost completely to eastern border crossings. Meanwhile, the volume that was previously made up of lumber exports has been largely replaced by other export commodities. In 2024, in addition to fertilizers, polymers and goods from the chemical and pulp and paper sectors make up the bulk of transported cargo.
The volume of export container shipments from Russia in UTLC ERA services in 2023 - 2024, TEU
Source: UTLC ERA
2023
2024
from Kazakhstan to China
As a result of geopolitical changes, shipments from Kazakhstan to China have seen substantial growth. Kazakhstan’s exports totaled 27,460 TEU, marking an eightfold rise over last year’s shipments. Agricultural products make up the bulk of the shipments.
Over the year, the Company experienced challenges with plan alignment and reduced capacity. However, the retention of existing services and the introduction of new ones supported stable and growing shipments. Notably, a project has been developed to facilitate shipments from the EU to Central Asian countries. A consolidated container block train No. 1275/1276 has been launched, departing from Brest-Severny station to Aktobe-2 station, with further distribution to various stations on the Kazakh and Uzbek railways.
Export container volumes from Kazakhstan in UTLC ERA services in 2023‑2024, TEU
Source: UTLC ERA
2023
2024
2.2


During 2024, heightened volatility and rising ocean freight rates on the Asia‑Europe corridor, driven by the Red Sea shipping crisis, were observed. This record had a positive impact on China‑Europe‑China transit volumes handled by the Company.
However, following recent developments that have reduced geopolitical tensions in the Middle East, the chances of restoring normal transit through the Suez Canal have significantly increased. Restoring this route is expected to reduce transit times, free up capacity, drive down ocean freight rates, and trigger other shifts, potentially enhancing the competitiveness of maritime logistics over rail.
Import rail traffic
By year-end, the share of import rail shipments from China to Russia via the Dostyk and Altynkol border points in UTLC ERA services declined significantly. Rising transit flows to Europe, combined with infrastructure bottlenecks, have to some extent crowded out imports to Russia. Notably, imports grew in the final months of the year, during a period of reduced transit flows, highlighting continued demand for the China‑Russia/Belarus route through Kazakhstan’s border crossings.
Export rail traffic
Export rail traffic from Russia and Belarus to China and Central Asia remains steady, with potash fertilizer exports from Belarus continuing to be the main driver. Significant production growth drives down costs, which could, in theory, influence sales volumes. Despite this, global producers anticipate continued growth in the potash fertilizer market over the next year. Expanded exports from Russia in the year’s second half, supported by the addition of new cargos, are expected to grow further in 2025. The sharp increase in agricultural shipments between Kazakhstan and China has cemented this segment as another strategic direction for the Company’s service development.